In this article, you’ll find tools that will help you present a large set of data in minutes and in a more comprehensible fashion for your audience.
Posted January 20th, 2021 in Content.
Whatagraph is designed to simplify the reporting and analytics tasks with the help of automatic data visualization functionality. With Whatagraph, you can easily transform website and social media numbers into robust, clear, and simple infographic reports.
Posted July 16th, 2020 in Advertising.
In this article, we define data visualization and examine ten website applications for performing it.
Posted December 6th, 2019 in Content.
MindMeister is an online mind mapping tool, which allows customers to visualize, develop and share their ideas.
Posted September 3rd, 2018 in Productivity.
A simple collection of random data can often be confusing and unintelligible. However, if you organize it and attach meaning to it, it can depict useful information for different purposes. When it comes to depicting information the right way, there are quite a few alternatives. More often than not, information about systems and procedures is […]
Posted April 5th, 2016 in Content.
Flowcharts are one of the basic building blocks of system design. They depict complex details of a proposed system through simple rectangular, diamond-like and circular shapes. They’re a picture that can explain a layman what a technically advanced, IC powered system would behave like when fully functional. So it is extremely important that designers who […]
Posted February 3rd, 2016 in Content.
If your organization uses Gantt charts for project planning, you know they’re horizontal bar charts used to bring about better project management through production planning and control. Such charts provide a graphical illustration of a schedule that helps to plan, coordinate, and track specific tasks in a project. When they play such crucial role for […]
Posted September 16th, 2015 in Misc.
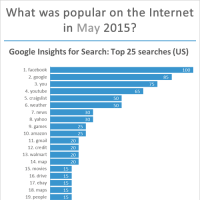
What was popular on the Internet in May 2015? Google top 25 search phrases Facebook top 25 Pages Twitter 25 most followed Google+ 25 most followed Alexa top 25 websites Web browsers market share. Scroll down for Twitter TAKEAWAYS (or click here) Feel free to use this infographic on your blog or website, but […]
Posted June 2nd, 2015 in Statistics.
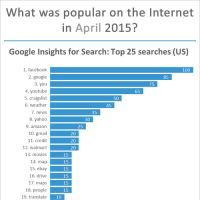
What was popular on the Internet in April 2015? Google top 25 search phrases Facebook top 25 Pages Twitter 25 most followed Google+ 25 most followed Alexa top 25 websites Web browsers market share. Scroll down for Twitter TAKEAWAYS (or click here) Feel free to use this infographic on your blog or website, but […]
Posted May 4th, 2015 in Statistics.
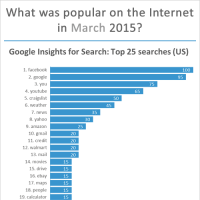
What was popular on the Internet in March 2015? Google top 25 search phrases Facebook top 25 Pages Twitter 25 most followed Google+ 25 most followed Alexa top 25 websites Web browsers market share. Scroll down for Twitter TAKEAWAYS (or click here) Feel free to use this infographic on your blog or website, but […]
Posted April 1st, 2015 in Statistics.
Browse Categories
Superhero-powered monitoring of website or web application availability & performance
Browse Categories: Advertising ▪ Analytics ▪ Communications ▪ Content ▪ e-Commerce ▪ Email Marketing ▪ Featured ▪ Growth hacking ▪ Infographics ▪ Interviews ▪ Misc ▪ Mobile ▪ Monitoring ▪ Productivity ▪ Resources ▪ Sales ▪ Security ▪ SEO/SEM ▪ Social Media ▪ Statistics ▪ Testing ▪ Tutorials ▪ Web Apps in General ▪ Web Design ▪ Web Development ▪ Web hosting ▪ Sitemap
© Super Monitoring - website availability monitoring - SITEIMPULSE® 2010-2025 - All Rights Reserved. | Privacy Policy | Contact us