

Depict information easily with Infogr.am
A simple collection of random data can often be confusing and unintelligible. However, if you organize it and attach meaning to it, it can depict useful information for different purposes. When it comes to depicting information the right way, there are quite a few alternatives. More often than not, information about systems and procedures is depicted through various diagrams such as charts, graphs, flow charts, use cases and more. However, unless one has extensive experience in making them, people often commit embarrassing errors while creating simple charts or graphs.

To avoid giving a wrong impression to clients or customers and to create easy to understand charts / graphs / diagrams that present correct information about your business in a concise way, the best option is to use an automated tool that takes data as input and gives ready diagrams as output. In this discussion we’re focusing on one such online tool that serves as a haven for those hoping to create great charts in a few simple clicks. Presenting – Infogr.am!
Infogr.am – Create & Publish Interactive & Engaging Charts / Graphs
Infogr.am lets you create and publish beautiful visualizations of your data. Highly interactive and responsive charts let users play around with data representations like never before.
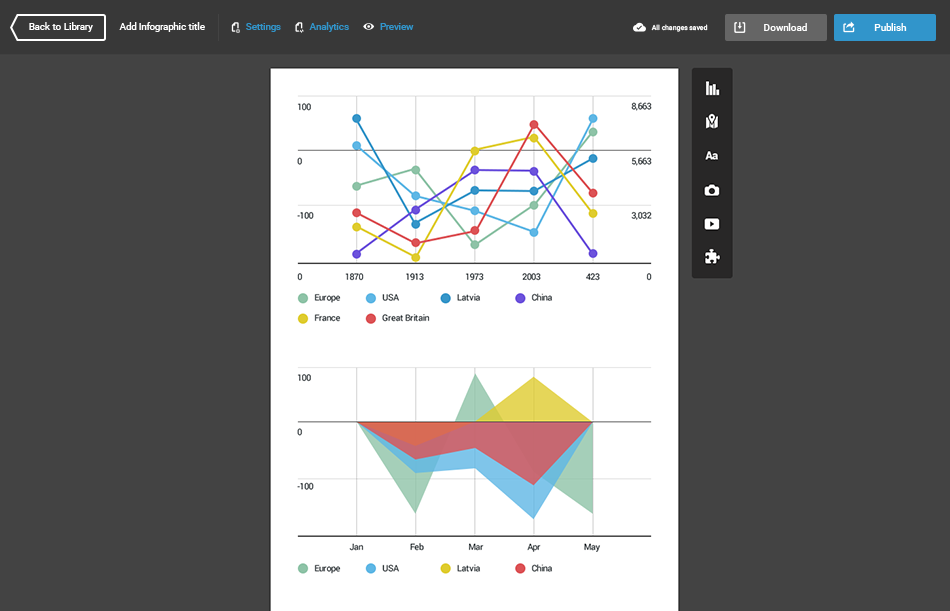
Picture this scenario – You see a complex graph in-front of you but don’t understand it. How the data on the x-axis affects the data on the y-axis is something you just cannot comprehend in a single look. You wish there was some explanation with the chart that would make things easier. With Infogr.am, you don’t need any explanation. You can click-and-drag or touch-and-drag around data values in the charts to see their real-time effect on other values and understand all intricacies.
Infogr.am lets you make your charts move at your commands. Its interactive visualizations add a new dimension of engagement and experience for readers across a wide range of devices. What’s more, you can connect live data sources to Infogr.am’s infographics so that charts are updated in real-time to reflect the latest values. Using static data to make charts is so old-school! Additionally, with Infogr.am, you can embed and share infographics and charts anywhere – documents, web-pages etc. You can even download them and share them privately. Above all, this unique tool lets you brand-ize your charts. Whenever you need to add life to a report, insert a custom, attractive, branded infographic from Infogr.am in a few clicks.
With over 30 chart types (bar graphs, line graphs, area graphs, map distributions etc.) to choose from, Infogr.am makes sure it has at least one chart suited to every organization’s need.
This is how it works
There are 4 legs of the tool’s scope. Depending upon your purpose, you can use Infogr.am for:
- Media & Blogs
- Education
- Brands
- Organizations
For each, you’ll first need to create a free account with the tool. For this all you need to supply is your full name, email id and the purpose for which you wish to use the tool (choose from one of the options listed above).
Once your account is created, you can start with the design. Choose what you wish to create: Infrographic or Report / Chart or Graph / Map. All these options are displayed within small blue squares and on hovering on each a plus sign appears indicating a prompt to add new. You can create a folder for each project and store the diagrams you create accordingly.
Infographic or Report
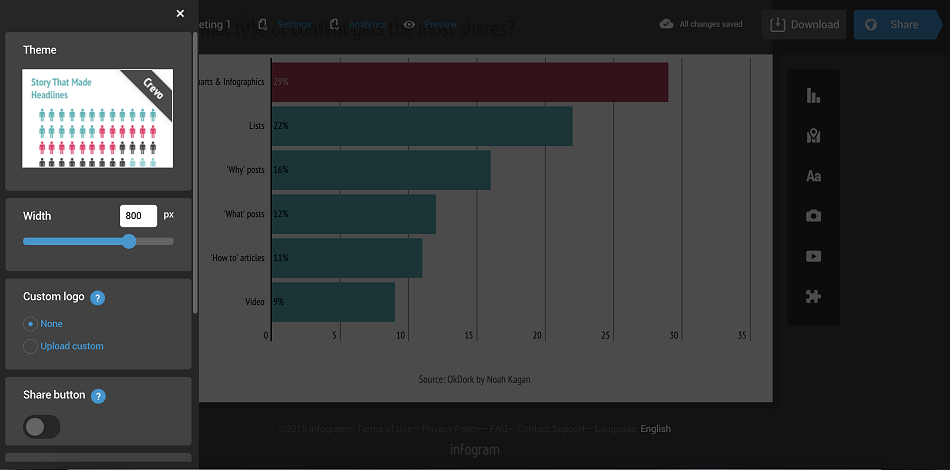
Clicking on this option expands the page to display various themes for your project. There are free themes and pro themes. For starters, you may want to stick to the free themes. Each theme has different color and font schemes and to select a theme all you need to do is hover over it and click on the “Use Design” prompt that appears. Once selected, a sample graph is displayed in a pop-up with helpful tips showing how to work with it. Follow the tips to get a basic know-how. Double-clicking on values opens up an Excel like editor on the left hand side of the screen wherein you can edit values. Here you can also change the kind of graph. To directly upload values, you can also upload CSV or Excel files to the tool.
Chart or Graph
Clicking on this option opens a pop-up with graph options on the left hand side and format options on the right. For example, a bar graph in radial format will display a radial formed with colored bars depicting information. The editing and other options can be accessed as described above.
Map
Clicking on this option opens a pop-up with a black-and-white world map. Other available countries are listed in the left hand side and their respective maps open up on the right on clicking on the country names. For the free account, only the world map and the map of U.S.A are available. For maps of specific countries you’ll need to upgrade your membership. Editing options are described above.
In addition to these options, you can choose to import data or source from Google Spreadsheet, Dropbox, OneDrive or JSON feed.
Additional Features
Infogr.am can also be used for team collaboration. Shared folders, access permissions and a simple per-seat pricing can allow your team to efficiently make your data look its best with Infogr.am. However, this feature is not available on a basic account. You’ll need to sign up for a Business or Enterprise plan to avail this.
Pros Vs Cons
The high points of the tool are evident from its description above.
As far as the low points are concerned, it all comes down to the price. At $25 per per person per month under a Pro plan and $79 for a single / team license under a business plan, the tool is a bit on the pricy side.
Who knew creating Infographics could be so much fun? Check out infogr.am/ @infogram via @supermonitoring
Final Words
This one is actually a great tool. With no learning curve it lets you create attractive and interactive charts and reports to make your work more fun. If you’re not looking for very extensive features, this tool might be all you need. But if you want more, well, you gotta pay for it!


