Interesting statistical data or processes presented in an attractive graphic form. Image files to use and publish on your own website.
How many website monitoring service providers are there, worldwide? Where are they from? What features do they offer? How much do they charge?
Posted June 15th, 2020 in Infographics.
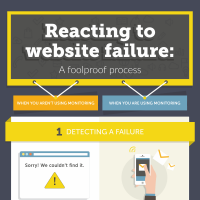
Faultless websites, online stores or web apps simply don’t exist. Despite an exemplary infrastructure, duplicated systems and excellent mechanisms, something can always go wrong. We offer you a proven process that you can apply in a crisis situation – adapting it accordingly to your conditions, of course. You can publish our infographic on your blog […]
Posted February 12th, 2018 in Infographics.
Check this awesome infographic designed by Newt Labs – and share it to help building awareness of uptime montoring services necessity. Source: How to Boost Your WordPress Site and Business with Uptime Monitoring P.S. Did you know that Super Monitoring offers a WordPress Plugin? Takeaway Tweet “Uptime monitoring should be a priority within your […]
Posted November 2nd, 2017 in Infographics.
This year’s edition of the infographic designed by SITEIMPULSE contains a list of more than 100 tools (web applications) essential – or at least very useful – in every day work of Internet Marketers. Many of the applications listed have been described on our blog. Source: E-Marketer Tools by SITEIMPULSE – 2017 Edition
Posted January 18th, 2017 in Infographics.
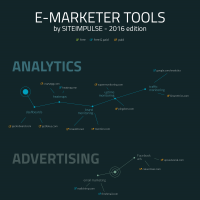
We are presenting an infographic created by SITEIMPULSE – an we are sure you will find it interesting. It is a list of over 80 web tools (SaaS) that are useful for e-Marketer’s every day work. (Clicking on the infographic opens it in its full size) Source: E-Marketer Tools by SITEIMPULSE – 2016 edition
Posted January 13th, 2016 in Infographics.
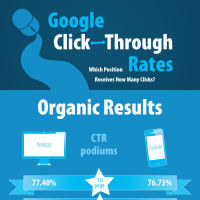
Which position in Google search results receives how many clicks? How does it look for organic results and for ads? What are the differences between desktop and mobile? Take a look at our infographic below. Scroll down for Twitter TAKEAWAYS (or click here) for a larger version click here Feel free to use this infographic […]
Posted January 29th, 2015 in Infographics.
HUGE infographic about mobile adoption, vendors and platforms, mobile usage, business, e-commerce, payments and advertising.
Posted September 23rd, 2013 in Infographics.
More than 25,430,000 articles in 284 languages, edited more than 1,541,390,000 times since 2001. Read more astonishing facts and numbers.
Posted March 14th, 2013 in Infographics.
8000 pixel long infographic with tons of interesting numbers on LinkedIn.
Posted December 10th, 2012 in Infographics.
Current statistics and timeline of Twitter in the form of an infographic.
Have it here
Posted November 7th, 2012 in Infographics.
Browse Categories
Superhero-powered monitoring of website or web application availability & performance
Browse Categories: Advertising ▪ Analytics ▪ Communications ▪ Content ▪ e-Commerce ▪ Email Marketing ▪ Featured ▪ Growth hacking ▪ Infographics ▪ Interviews ▪ Misc ▪ Mobile ▪ Monitoring ▪ Productivity ▪ Resources ▪ Sales ▪ Security ▪ SEO/SEM ▪ Social Media ▪ Statistics ▪ Testing ▪ Tutorials ▪ Web Apps in General ▪ Web Design ▪ Web Development ▪ Web hosting ▪ Sitemap
© Super Monitoring - website availability monitoring - SITEIMPULSE® 2010-2025 - All Rights Reserved. | Privacy Policy | Contact us