

Top 11 Website Performance and Availability KPIs You Should Care About
The availability and performance of a website is critical to achieving success for the business behind it. That’s why website owners must deeply concentrate on monitoring and sweetening their website’s Key Performance Indicators (KPIs).
In our post today, we aim to get to know the top 11 availability and performance KPIs website owner should be aware of. We will categorize these indicators into three segments: availability KPIs, performance KPIs, and user engagement analytics. Each segment discusses how benefiting from these metrics can lead to the website’s maximized dependability and user engagement.

Availability KPIs
1. Uptime
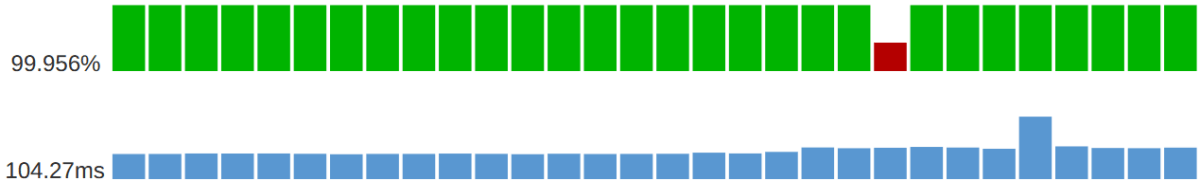
Uptime is an integral metric. It measures how dependable and available a website is. The metric displays the percentage of time the website has been working and accessible — usually on a specific timeframe like a month.
In other words, uptime delivers a number in a percentage form to show the proportion of time a website has been online compared to a complete month. For example, an uptime of 99.9% says that the website has been available for 99.9% of the entire month, which is considered a minimum amount of downtime.
It’s critical for website owners to conserve their uptime because it leads to a positive user experience. On the other hand, downtime — periods of website inaccessibility — might result in diminished revenue, declined customer happiness, and harmed reputation.
Website owners assess their uptime percentage to check the performance of their hosting infrastructure, servers, and network connectivity. They discover trends/patterns in their uptime data to find issues, optimize system configurations, and perform redundancy tasks that minimize downtime and maximize availability.
2. Number of Incidents
The number of incidents is another crucial metric that shows how frequently a website’s availability is disrupted. An incident refers to a period when the website encounters downtime or becomes inaccessible.
Tracking the number of incidents shows how unchanging the website infrastructure is. Website owners use this metric to discover trends, patterns, and original causes of downtime, such as server issues, network outages, or software glitches.
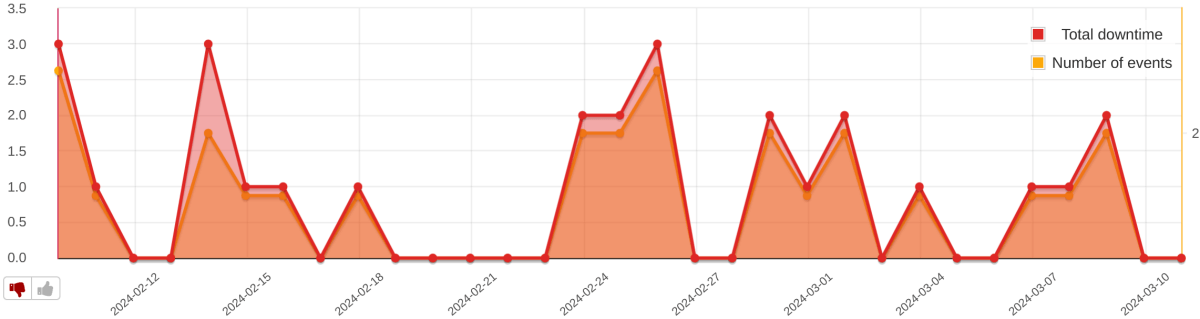
Numerous organizations use the number of incidents, in the long run, to evaluate how effective their infrastructure is. This helps them discover room for improvement. For example, an impulsive boost in incidents can be a sign of server overload or insufficient resources. Also, analyzing this data helps organizations enhance their website availability using the right resources and investment.
Conducting measures such as redundancy, failover systems, and proactive website monitoring can cancel out the effects of incidents and downtime. Eventually, this leads to a sweetened user experience and a conserved brand reputation.
3. Mean Time to Recover (MTTR)
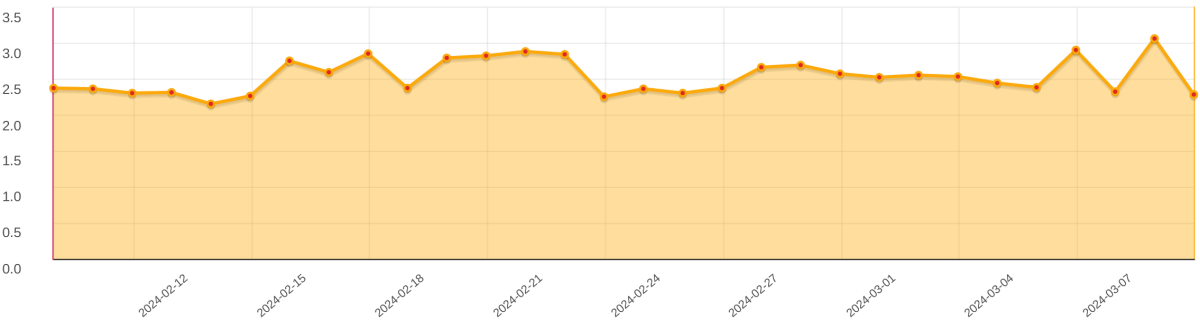
Mean Time to Recover (MTTR) is a vital metric that measures the average duration it takes to restore a website to full functionality after experiencing downtime or an incident. It basically measures the time from when an incident is detected to when the website is back online.
This metric gives a bright idea of how efficient the incident response and recovery processes of a website are. Lower MTTRs mean faster recovery from incidents.
Website owners use MTTR to detect issues in their incident management and apply adjustments if necessary. Then, they can simplify response techniques, invest in automation, and provide sufficient training to their support teams to lessen MTTR and boost their website availability.
Constant monitoring of MTTR enables organizations to remain competitive in the market. They’ll be able to respond to incidents more swiftly, reduce downtime, and enhance user happiness. Also, they’ll be able to respond with alacrity when encountering unanticipated hardships.
Performance KPIs
4. Average Response Time
Average response time is a vital performance metric that measures the time it takes for a website server to respond to your request. We mean the whole process, right from when you initiate a request — like clicking somewhere — until the server responds and renders the content. Lower response times prove the server can process requests and respond more instantaneously.
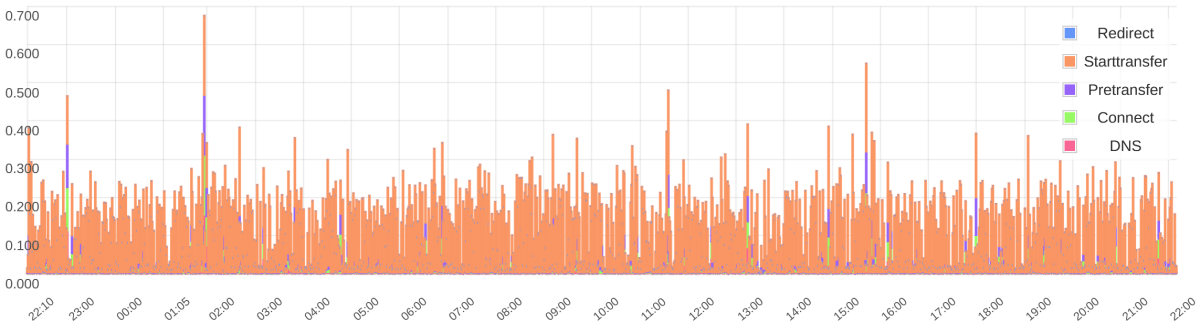
Monitoring this metric helps you present a smooth/responsive user experience. Slower response times can discourage users, leading to augmented bounce rates and diminished engagement. Elements that can affect this metric are:
- Server performance
- Network latency
- Website architecture
- Complexity of the request
Website owners analyze average response time data to identify performance stoppage, enhance server configurations, and execute caching strategies to expedite the website’s responsiveness. A fast and consistent response time helps you retain your users, boost their satisfaction, and maximize your conversions and revenue.
5. Page Load Speed
Page load speed shows the time a web page needs to display its content completely in the user’s browser after their request. It’s a critical performance metric that directly affects user experience. Factors that alter this metric are:
- Server response time
- Network latency
- Browser rendering
- Size and complexity of the content
Fast page load speed keeps users satisfied. Clearly, users are prone to leaving websites with slow load times, which results in higher bounce rates and lower conversion rates. It should also be noted that page load speed isn’t just for the home page; users expect fast load speeds across the entire website, especially important pages such as product cards that drive conversions or contain critical information.
Website owners who tend to enhance their page load speed can do so by:
- Optimizing images and multimedia
- Minimizing HTTP requests
- Leveraging browser caching
- Using content delivery networks (CDNs) to serve content more efficiently
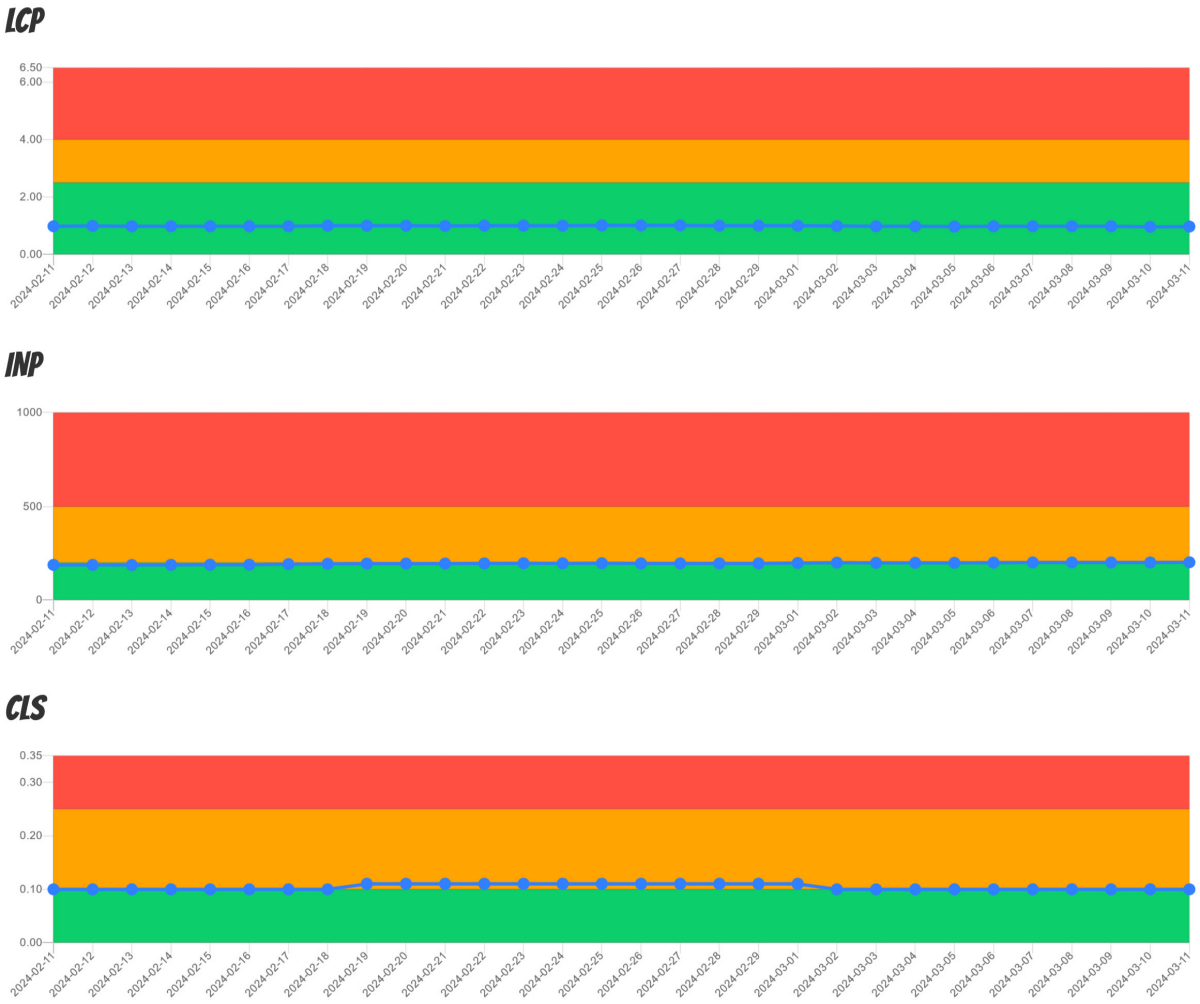
6. Core Web Vitals
Core Web Vitals are a group of performance metrics that measure critical elements of user experience. These metrics are as follows:
- Largest Contentful Paint (LCP): This metric measures the time it takes for users to observe the largest content element on a web page. It’s somehow the loading speed of the page. Today, websites should endeavor to obtain an LCP of less than 2.5 seconds for speedy performance.
- Interaction to the Next Paint (INP): This metric measures the responsiveness of a website by calculating the time required for a page to become fully interactive after the user’s action. It’s the delay between the user’s input and the resulting visual response/paint on the screen. A lower INP indicates a smoother and more responsive website.
- Cumulative Layout Shift (CLS): This metric assesses the visual stability of a web page. It calculates unpredicted layout shifts that happen as the page is loading. This means how often page elements suddenly change their position and force the user to click on the wrong position. Minimized CLS provides users with a satisfying browsing experience.
User Engagement Analytics
7. Unique Users
Unique users of a website are referred to as those who access it within a specific time frame — like a day, week, month, or other specified period. It shows the reach and audience size of a website, delivering the number of distinct users who have interacted with the site during a certain period.
Monitoring this metric shows the total traffic volume and user demographics of a website. It helps website owners assess their marketing campaigns, content strategies, and user acquisition endeavors. They can track the changes in this metric versus time to detect growth trends, seasonality patterns, and the impact of external factors on website traffic.
Besides, analyzing the number of unique users simplifies targeted marketing for website owners. It enables them to deliver personalized content for a specific portion of their audience. This results in sweetened user experiences, skyrocketed engagement, and elevated conversions.
8. Bounce Rate
Bounce rate is an integral user engagement metric that measures the percentage of visitors who leave the website once they view just a single page. High bounce rates show that the majority of users who visit a single page don’t desire to interact with other pages and additional content. It’s a sign of potential issues with relevance or content quality.
Monitoring this worthwhile metric can help you assess the efficiency of landing pages and their user experience. Lower bounce rates are an indicator that users are more interested in spending more time on the site. On the contrary, higher bounce rates depict that users can’t find what they’re looking for, or they’re facing discouraging obstacles.
Website owners who tend to reduce their bounce rate should:
- Optimize their landing pages
- Enhance their content relevance/quality
- Improve their site navigation
- Provide a smooth user experience across devices
They can analyze bounce rate data and employ well-thought optimization strategies to maximize their user engagement and boost their conversion rates.
9. Average Session Duration
Average session duration — also referred to as dwell time — measures the average time a user stays on a website during a single session. This metric shows how engaged and interested users are when dealing with the content and functionality of the website.
Longer average session durations imply that visitors are highly amused with the content. They tend to discover multiple pages and are highly likely to perform actions such as reading articles, watching videos, or making purchases.
Monitoring this metric lets the website owner assess the usefulness of the website’s content, user experience, and their engagement techniques. It helps them find out how fascinating and persuasive their content is, and where there’s room for progress.
Website owners usually analyze trends in session duration data to discover pages or sections that are more attractive to users. They can also find areas where users are possibly encountering friction or different obstacles. To maximize their average session duration, they need to present suitable and helpful content, optimize their site navigation, and provide clear calls to action.
10. Pageviews per Session
Pageviews per session is a crucial metric that delivers the average number of pages a user checks during a single visit. It’s an indicator that quantifies how interested users are in website content, and how successful the website is in motivating users to visit more pages other than the landing page.
Higher pageviews per session prove that visitors tend to view multiple pages of the website, interact with diverse content/features, and possibly progress further. This metric is more integral for websites that work based on their content. For them, increased pageviews per session mean boosted ad revenue, enhanced user retention, and sweetened user experience.
Monitoring pageviews per session allows website owners to discover areas wherein users are more interested. They can find out which content or sections of the website are more popular. As a result, they can find potential opportunities for upselling and maximizing their revenue.
Website owners can analyze various trends in pageviews per session to make use of useful strategies that can encourage users for more interactions. This way, they can lay the foundation for more invaluable interactions and achieve their business demands in a flash.
11. Conversion Rate
Conversion rate is the last but not least critical metric today. It measures the percentage of visitors who complete an expected action/goal, including making a purchase, signing up for a newsletter, or filling out a contact form. This indicator shows how successful the website is in achieving the objectives of the business.
Higher conversion rates imply that a great proportion of users are taking your preferred action. This can result in heightened revenue, customer acquisition, and business success. Contrarily, low conversion rates convey the message that there are potential barriers or friction points that need to be identified, including intricate checkout processes, murky calls to action, or lack of trust signals.
Monitoring conversion rate helps website owners discover areas for optimization, including:
- Refining landing page design
- Simplifying the checkout process
- Running targeted marketing campaigns
Website owners can analyze conversion rate data and execute strategies to increase conversions. This results in a maximized return on investment (ROI) from their digital marketing measures, which is a primary goal in any business.
Final Words
As we discussed today, tracking and analyzing website performance and availability KPIs are a must for any website owner today. The market is more competitive than ever and monitoring these metrics is an outstanding strategy for website owners to discover areas where they can optimize their website.
It’s now needless to emphasize how substantial these eleven KPIs are in maximizing customer satisfaction and boosting revenue for any business. As a result, if you’re a website owner or a business manager, don’t hesitate to employ these metrics on your website today to achieve success in the long run.
About the Author

Robert Koch – experienced SaaS application designer and business optimization through automation consultant. An avid home brewer and cheesemaker in his spare time.


