

Core Web Vitals – what they are, how to measure and monitor them
Google has been saying for a long time that its primary goal is to improve the Internet in terms of increasing the quality of websites and the content published on them.
This fits in with typical business goals (not so widely announced), i.e. maximizing revenues generated by a search engine. The better quality of search results provided to users, the more clicks. And the quality of results will never be higher than the quality of the best pages and content available for a given query.
By holding the position of the number one search engine in most countries in the world and by publicly disclosing selected ranking factors, Google has a real influence on publishers who need to optimize their sites for these factors.
Page Experience Signals
The focus on the user and their “satisfaction” with search results and what they found on a page when they clicked on one of the top results has forced Google to go beyond evaluating just content – and become interested in User Experience.
Page Experience Signals represent a set of factors, unrelated to content quality, used by Google to evaluate websites for UX.
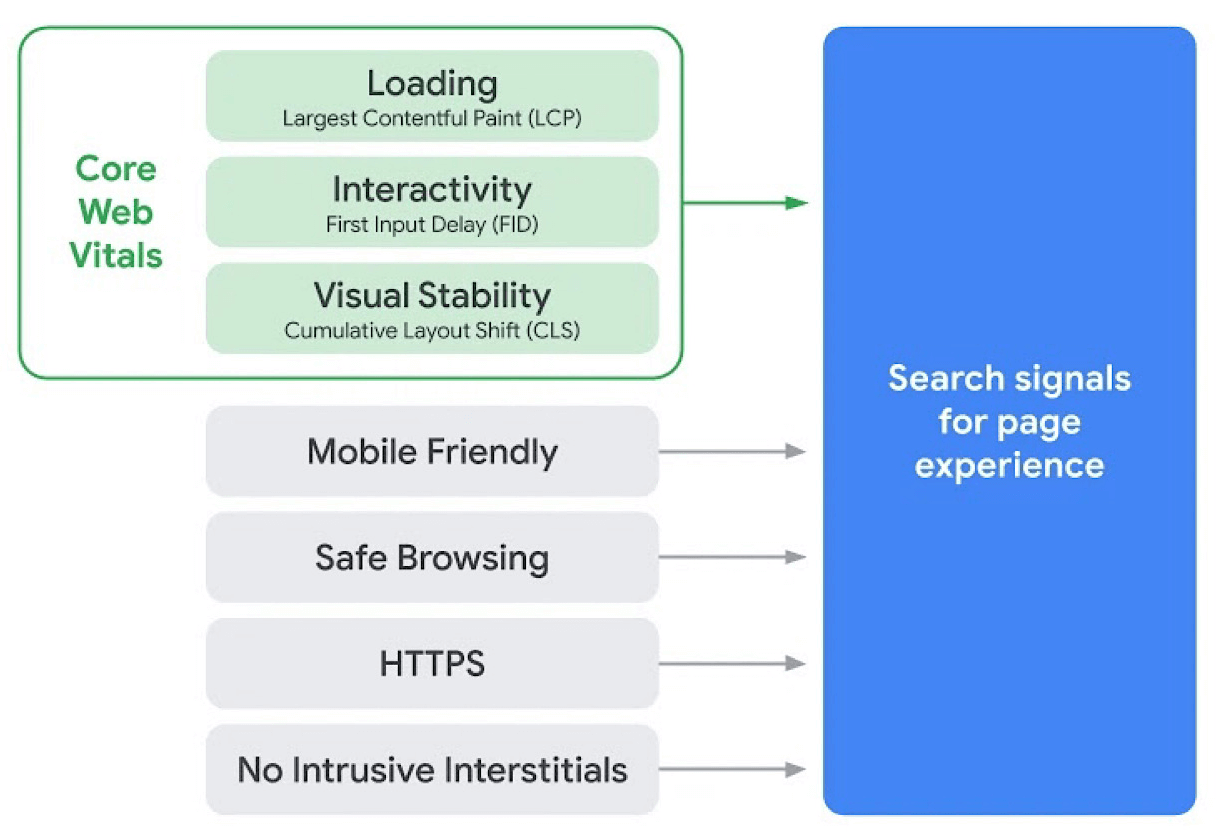
These factors are:
- Loading
- Interactivity
- Visual stability
- Mobile friendliness
- Safe browsing
- HTTPS (connection encryption)
- No Intrusive Interstitials.
The first three of these factors are Core Web Vitals and they joined the other four (already in use before) to become ranking factors in May 2021.
What are Core Web Vitals?
Core Web Vitals are not just a generic definition of the UX factors that Google is now going to consider when evaluating websites.
They’re also a set of specific metrics with details regarding how they will be measured and what levels of values are considered as good, requiring improvement, and bad.
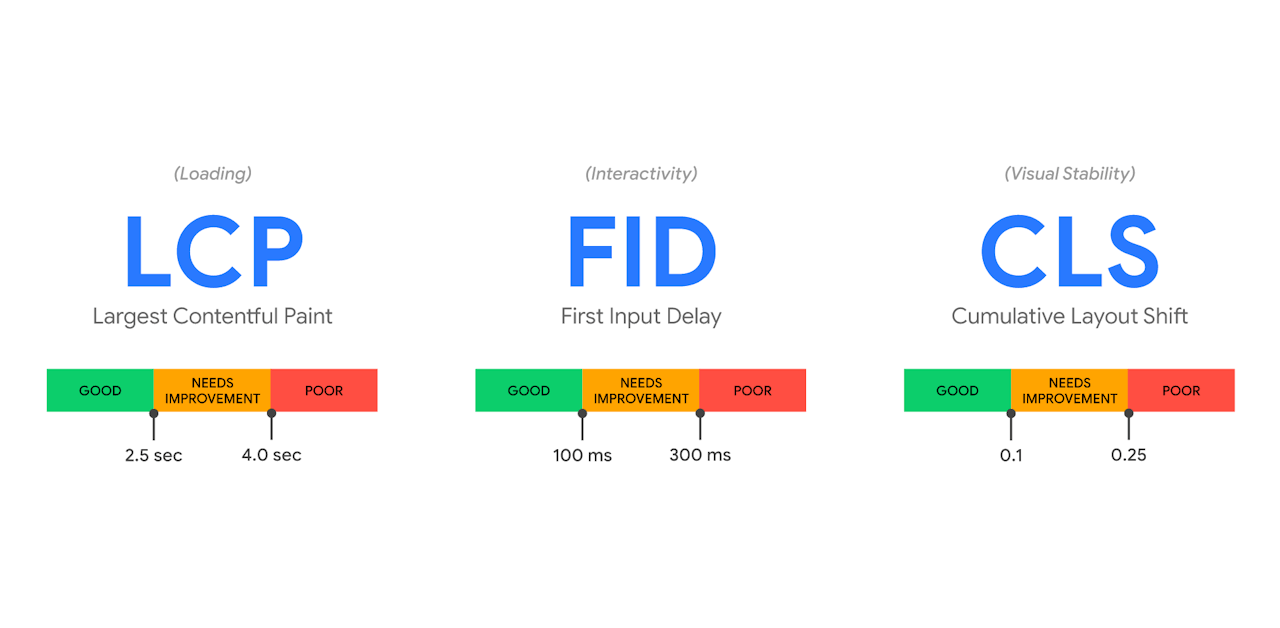
Loading: Largest Contentful Paint (LCP)
The total loading time of a website doesn’t represent a universally reliable value in terms of user experience since often most of the page is in the BelowTheFold area, which is invisible without scrolling.
The LCP indicator measures the perceived loading speed of a page. Its value is the time required to load the largest graphic element or text block inside the displayed section of the page (AboveTheFold).
LCP score evaluation
- Good LCP score: under 2.5 seconds
- LCP score requiring improvement: between 2.5 and 4 seconds
- Bad LCP score: above 4 seconds.

Optimizing a page for LCP
The following optimization tasks impact LCP scores:
- optimizing server response time
- optimizing images
- optimizing fonts
- optimizing CSS styles.
More about the LCP optimization
Interactivity: First Input Delay (FID)
Loading and displaying a website is one thing – making it ready to work is another issue.
FID, just like LCP, is related to the speed of a website. It measures the time a page takes to respond to an action performed by a user – such as clicking a link or button.
FID score evaluation
- Good FID score: under 100 milliseconds
- FID score requiring improvement: between 100 and 300 milliseconds
- Bad FID score: above 300 milliseconds.

Optimizing a page for FID
Actions to reduce the FID value:
- reducing the impact of code from external services
- reducing the execution time of JavaScript code
- reducing the number of requests to the server and the total volume of transfer.
Some tools (e.g. Chrome DevTools and Lighthouse) offer a Total Blocking Time (TBT) value instead of FID.
Visual stability: Cumulative Layout Shift (CLS)
You surely know the extremely annoying situation where you want to click an option in a menu, you move the cursor, and just before you press the button, the menu bar moves down and a big banner appears in its place to “steal” the click.
CLS is a concept for measuring the total value (number and volume) of such shifting of page elements while the page is loading and displaying.
CLS score evaluation
- Good CLS score: below 0.1
- CLS score requiring improvement: a value between 0.1 and 0.25
- Bad CLS score: above 0.25

Optimizing a website for CLS
Actions to reduce FID values:
- including dimensions of images and video objects in HTML
- reserving space with CSS for loading elements
- avoiding placing content above existing content
- avoiding animations that change the position of objects.
Lab data vs. field data
Each website’s Core Web Vitals have two sources of data:
- lab data – measurements made with specialized tools;
- field data – collected during visits by real users with the Chrome browser.
Lab data can be measured with Chrome browser, Page Speed Insights web applications, Web.dev, WebPageTest (see below), or by performing the measurement yourself, using the open code provided by Google.
On the other hand, field data collected by Google – specifically, a moving average of the last 28 days – can be obtained from the Chrome UX Report API – either by connecting yourself or using Page Speed Insights, Search Console, or the CrUX API Tool.
How to measure Core Web Vitals?
Google, while presenting Core Web Vitals, provided comprehensive documentation and a set of tools to independently analyze LCP, FID and CLS. In addition, Google also provided free access to field data collected during visits of thousands of Chrome browser users.
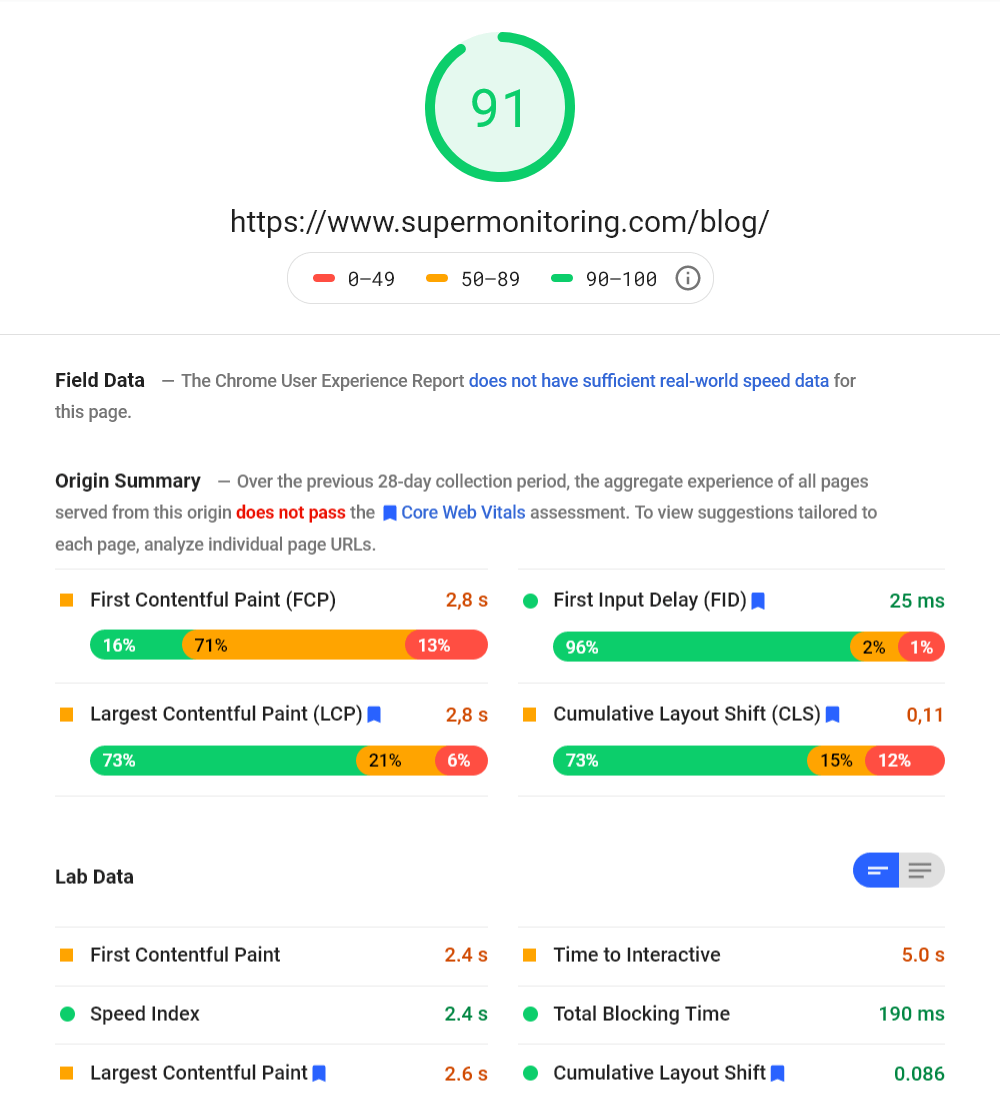
Page Speed Insights (Web)
In December 2020, the long-known Page Speed Insights tool began displaying Core Web Vitals field data from the Chrome UX Report API in addition to Lighthouse-based data. Of course, only for those pages for which a significant amount of data has been collected.

Web.dev (Web)
Also web.dev, which is a kind of an extension of Page Speed Insights, started to include Core Web Vitals. However, these are only lab data, i.e. measured during testing, from the Web.dev server.
Search Console

From a website owner’s perspective, it seems that the appearance of Core Web Vitals data in Google Search Console has been most useful. In the “Enhancements” > “Core Web Vitals” section, the results of field LCP, FID and CLS measurements started to appear. In addition, users started to receive alerts when there are problems with their values.

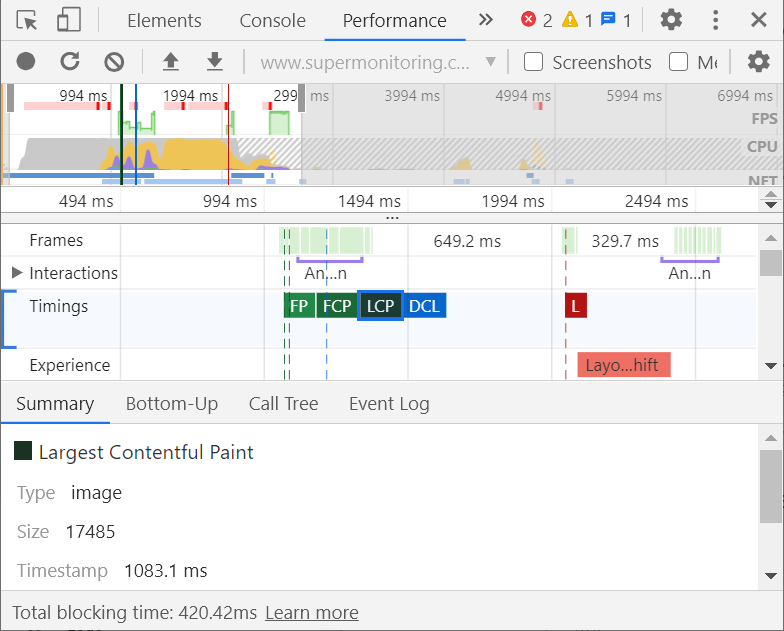
Chrome DevTools (browser)

If in the Chrome browser you press F12 (enable DevTools) and then change the tab to “Performance”, you’ll get access to detailed site performance analysis results, including Core Web Vitals. In the “Experience” section you will find information about layout shifts (CLS) and in the “Timings” section the LCP value. Finally, TBT is displayed in the footer of the report.
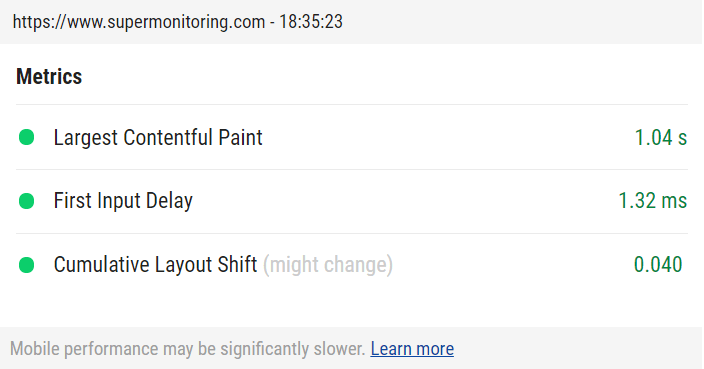
Plugin for Chrome Web Vitals (browser add-on)
The Web Vitals plugin for Chrome browser simplifies the way LCP, FID, and CLS values measured by the browser are displayed. It shows the measured values of these three metrics, simply, colored accordingly – depending on their rating.
Lighthouse (for developers)

Lighthouse is a professional tool for developers that analyzes website’s performance, used among others by the aforementioned Google Page Speed and Web.dev. It is available as an open-source package as well as plugins for Chrome and Firefox.
Google Lighthouse measures LCP, CLS and the aforementioned TBT, correlated with FID.
Chrome UX Report API (for developers)

The previously mentioned API for Chrome UX Report (CrUX) gives developers access to the results of thousands of measurements taken during actual site visits with the Chrome browser. Supplementing lab data with field data provides a fairly complete picture of a website’s UX rating in the “eyes” of Google.
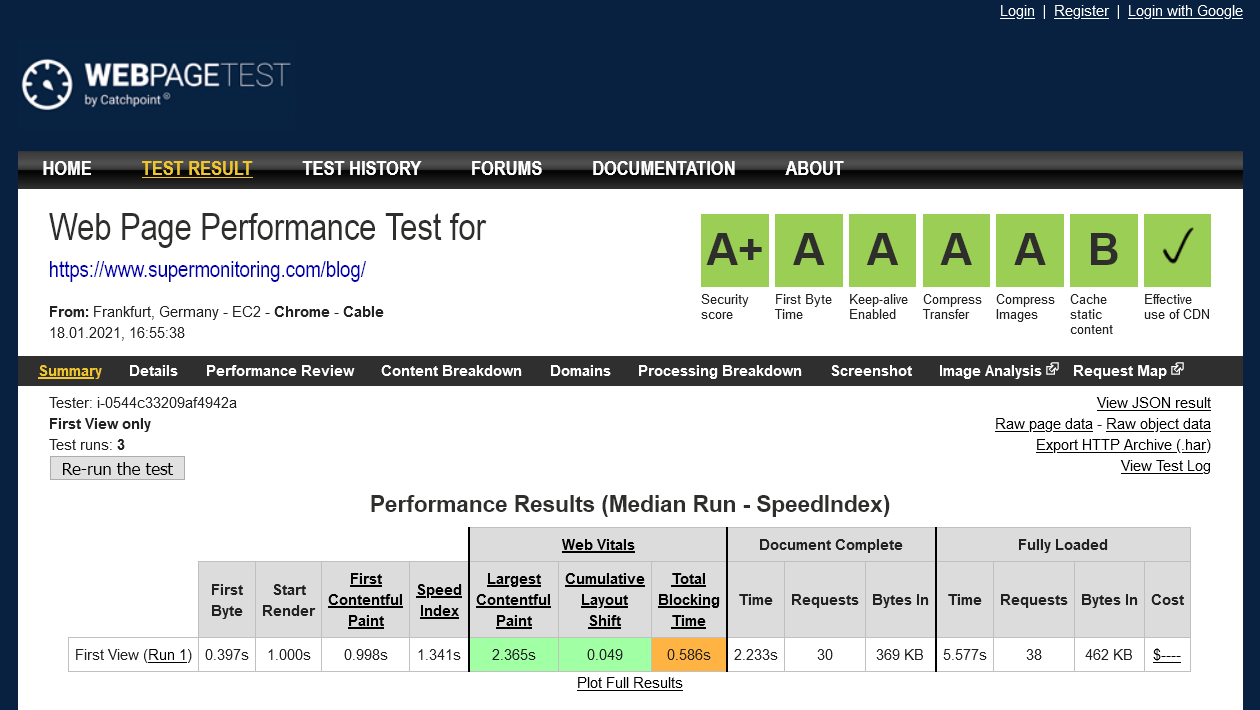
WebPageTest (Web)

The top independent web performance analysis tool, WebPageTest, acquired in September 2020 by Catchpoint, began measuring Core Web Vitals in December 2020. In addition to displaying measured LCP, TBT, and CLS values, WebPageTest provides “Filmstrip View,” an animated preview of page loading with the option to highlight layout shifts.
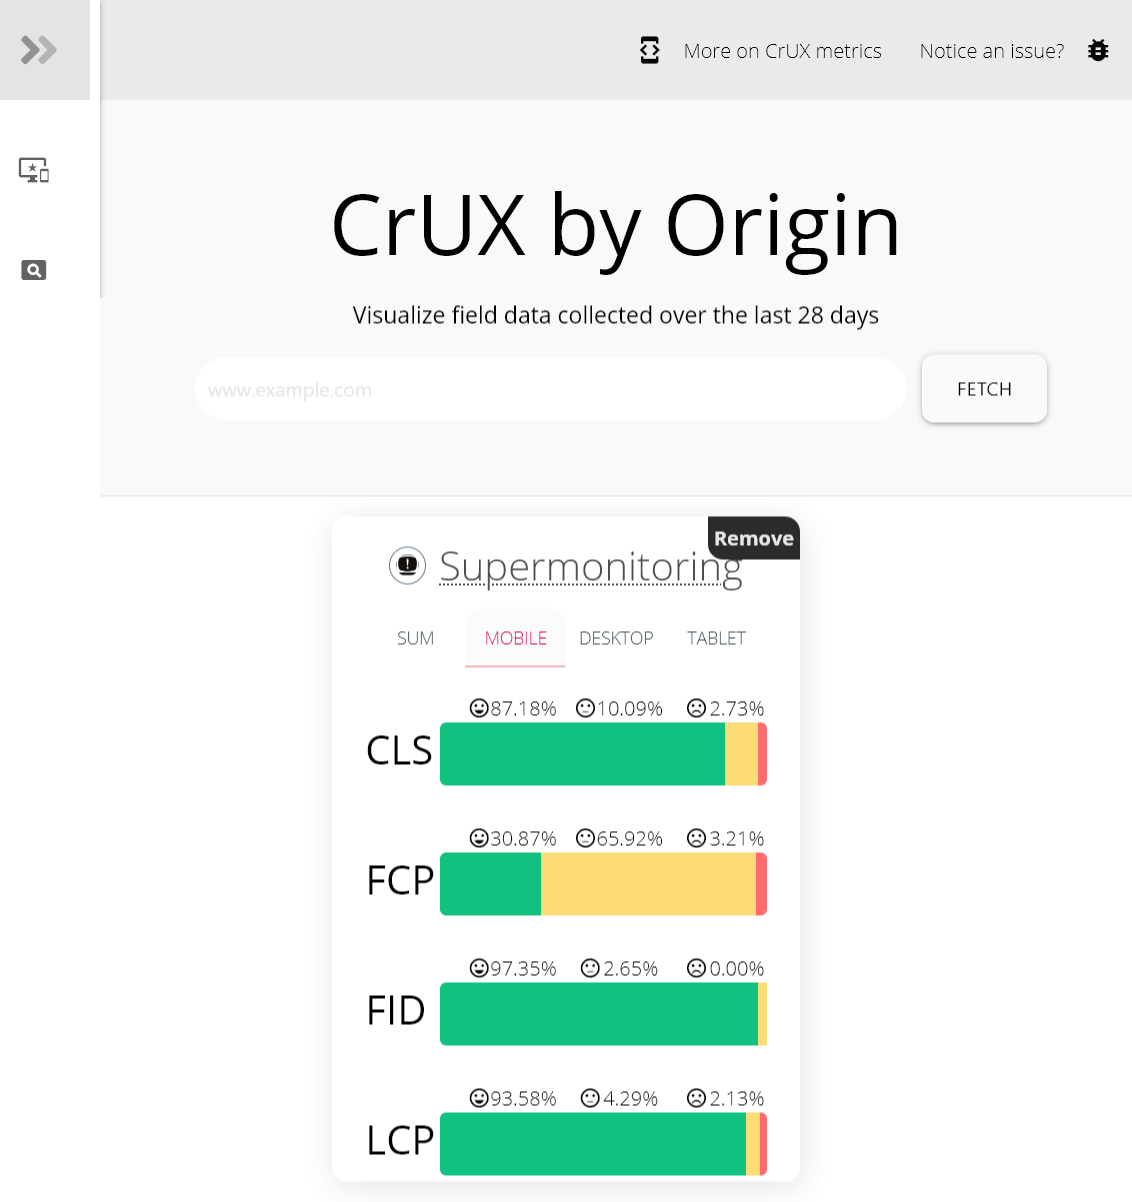
CrUX API Tool (Web)
The fastest way to preview the current Core Web Vitals field data values for any website is to use the CrUX API Tool. It’s a simple tool that downloads and displays data from the Chrome UX Report API.
Layout Shift GIF Generator (Web)

In late July 2020, Chris Johnson released this tool called „Layout Shift GIF Generator” for visualizing layout shifts (CLS) with an animated GIF. Animations are generated for both desktop and mobile devices. The tool is also available as an open-source package.
Monitoring Core Web Vitals
For constant tracking of LCP, FID and CLS, the most useful tool is Google Search Console. It displays the actual Core Web Vitals data in the form of graphs and provides alerts when the values of the indicators deteriorate.
Google Analytics
However, Core Web Vitals can also be monitored using Google Analytics. This is accomplished with the web-vitals library, which you need to load on the monitored site and then ensure that the results are sent to Google Analytics.
Here are detailed instructions for different versions of GA – analytics.js, gtag.js and Google Tag Manager.
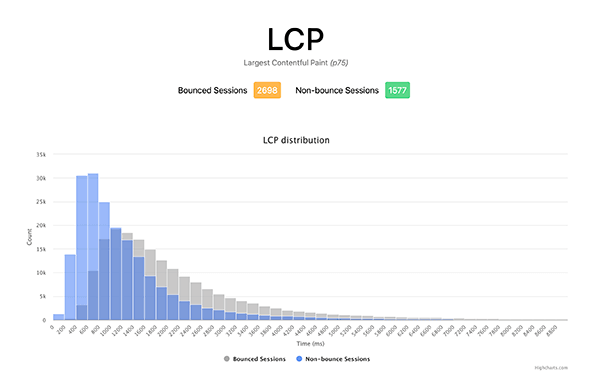
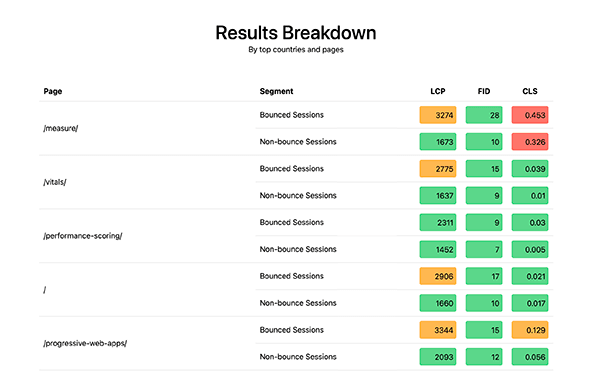
Web Vitals Report
Reviewing Core Web Vitals data collected in Google Analytics can be simplified by the Web Vitals Report application, also available as an open-source package.

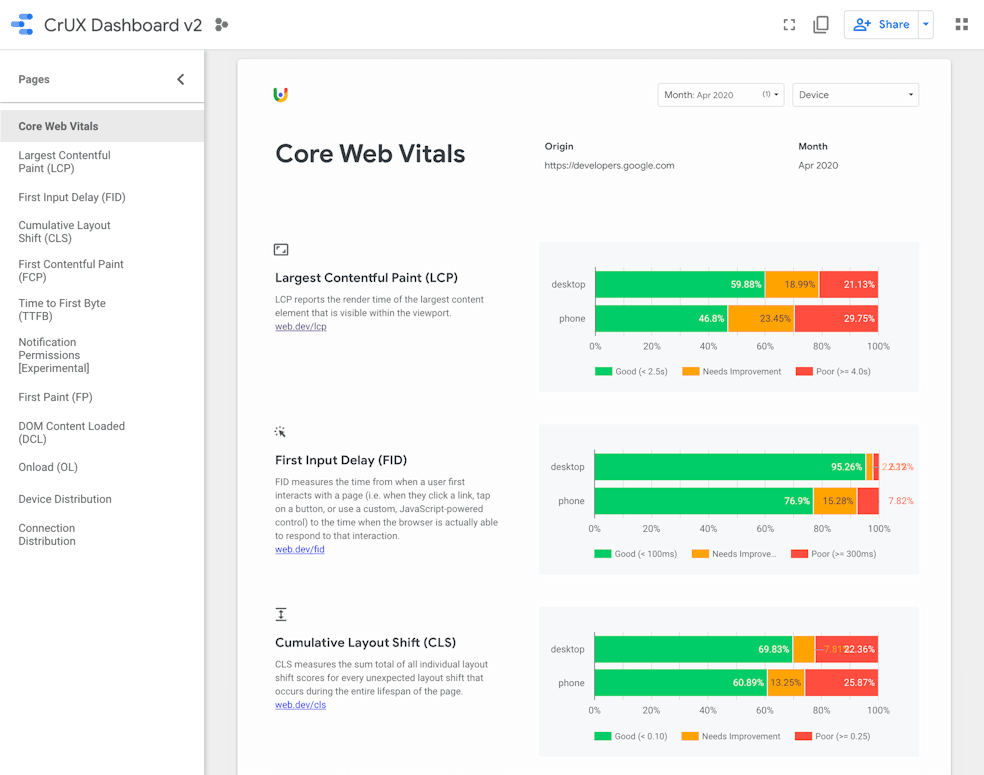
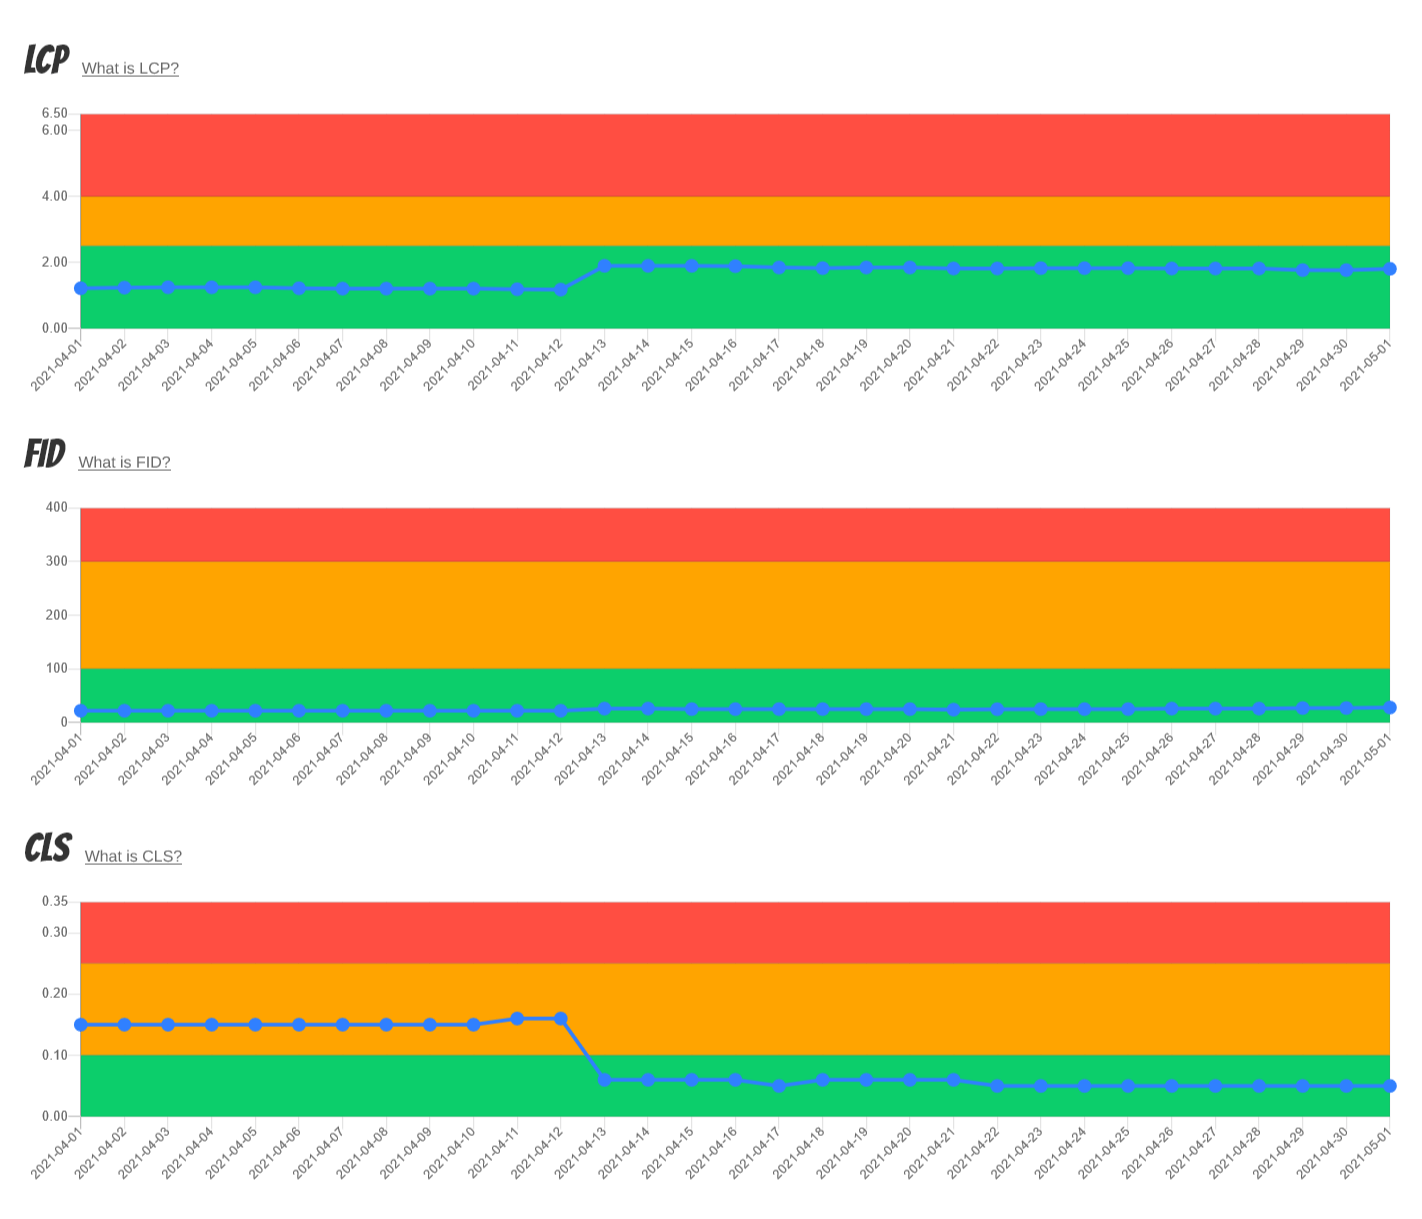
Google Data Studio
The field data available through the Chrome UX Report API can be linked to Google Data Studio, creating a custom dashboard. Rick Viscomi has put together a detailed instruction on how to do this.
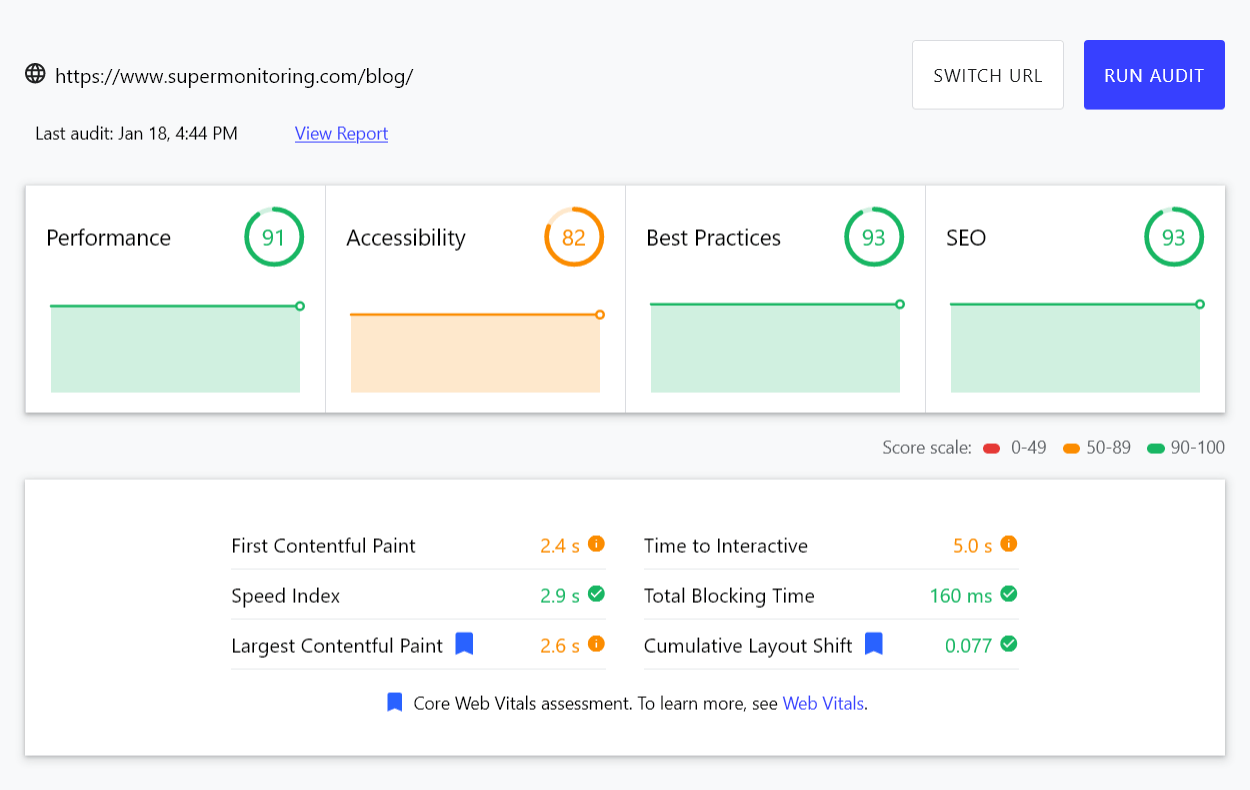
Super Monitoring
Super Monitoring, unlike the tools mentioned above, allows you to monitor not only Field data, but also Lab data. That is, it regularly takes its own measurements in an averaged environment.
This allows you to detect interaction deterioration as soon as it occurs – rather than only after a certain amount of time users have been using the deteriorated version.
Summary
In 2009, Google announced its intention to include page loading speed in ranking factors (which it did a year later). The world of website developers and owners was majorly focused on the loading time optimization craze. To date, it’s not clear how powerful factor is page speed. However, Google’s positive impact on the speed of the global Internet cannot be denied.
Now we have a similar situation with User Experience – in the form of Core Web Vitals indicators introduced by Google. No one wants to stay behind (fall in the rankings) with their website and is optimizing it (or is going to start in the near future) for UX.
We hope that our article will help you understand the new metrics, and the tools mentioned above will be useful in optimizing your site.
If you know other tools useful in the context of Core Web Vitals, write about them in the comments.


